
Irinos Measurement System
If incremental encoders with 1Vpp interface are used, a high signal quality is required for an accurate and reliable position value. The incremental input channels of the Irinos-System are equipped with a sophisticated signal analysis. Therefore the Irinos-System is able to detect errors, where many other systems would deliver a possibly invalid position value.
A signal level outside of the specified range may lead to an invalid position. The incremental channel will then provide an error flag in the hardware status. Further information can be found in the application notes in the users manual and in the MscDll reference manual (opcRHS).
The Irinos-Tool provides a live-view of the incremental encoder signals in a Lissajous diagram. In such a diagram, the signal level of the sine-signal is on the x-axis and the corresponding cosine-signal signal level is on the y-axis. If ideal signal levels would be available, a perfect circle would be the result if the encoder would move one electrical rotation. In reality such signals never exist.
The following examples show various signal levels:
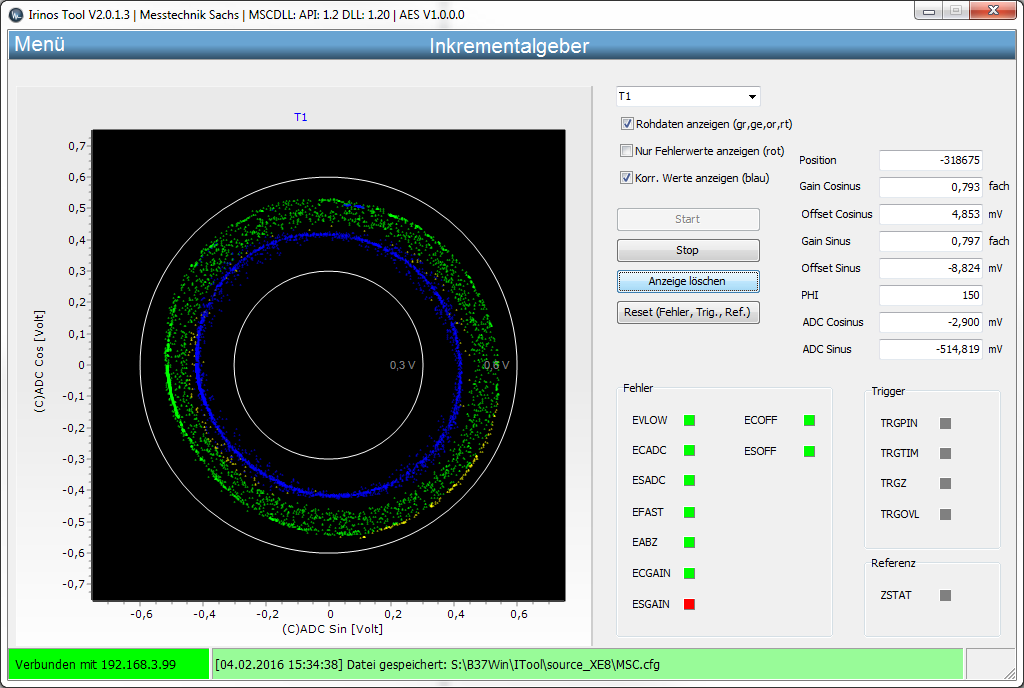
Live view with unstable signals
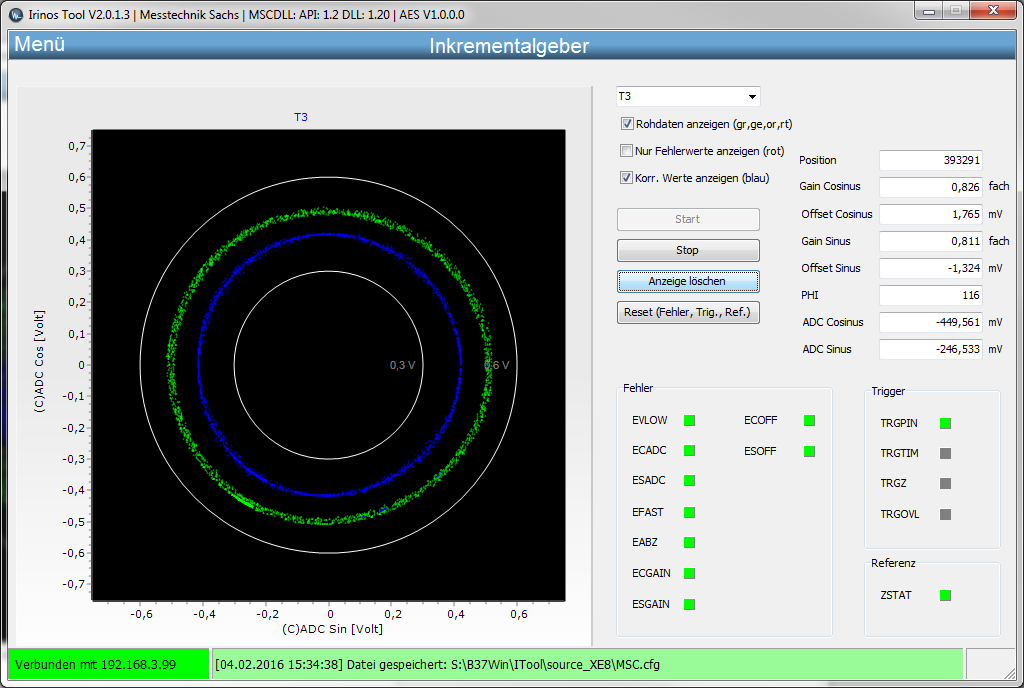
Live view with very good signal levels
For technical reasons, the signals never exactly match the specified 1Vpp input level. Hence the Irinos-Box IR-INC has a tolerance range of 0.6Vpp .. 1.2Vpp.
Lissajous diagram
The Lissajous diagram allows estimating the signal quality of the incremental encoder. Therefore the raw values are continuously requested from the incremental input channel of the Irinos-System. The live view can be started as follows:
1.Connect to the Irinos-System.
2.Open the Live view via Menu -> Incremental encoder.
3.Select the desired input channel (e.g. T3).
4.Press "Start".
5.Move / rotate the incremental encoder.
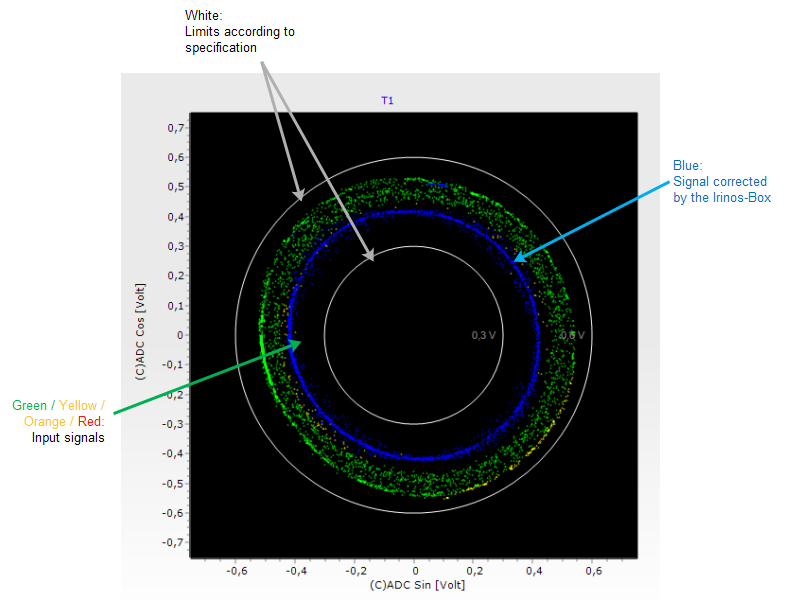
The resulting signal vector if the input signals ("raw values") will no be displayed. If the signal vector is next to the ideal signal level, it will be coloured green. The more it deviates, the more the colour changes to yellow, orange or red.
The inner and outer limits are displayed as a white circle.
Lissajous diagram
The Irinos-Box continuously corrects the input signal via its offset- and gain-control functionality. The corrected values are displayed in blue. Most of the signal deviations can be corrected. However, if the signal levels become too low or too high, this is technically impossible.
This example diagram shows large deviations of the input signal. Most of the values are green, but some are yellow or orange. This diagram has been recorded during moderate speed. If the speed increases, it is likely that the input signals will be out of specification.
Numerical values
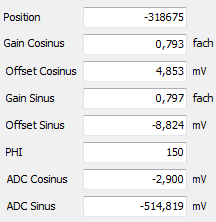
Next to the Lissajous diagram, the corresponding numerical values are displayed:
Numerical values
Position |
|
Measurement / position value of the incremental input channel |
Gain Cosinus |
|
Gain factor for the cosine signal. It is continuously updated by the internal gain control. |
Offset Cosinus |
|
Offset for the cosine signal. This value is continuously updated by the internal offset control. |
Gain Sinus |
|
Gain factor for the sine signal. It is continuously updated by the internal gain control. |
Offset Sinus |
|
Offset for the sine signal. This value is continuously updated by the internal offset control. |
PHI |
|
Phase angle of the input signal. |
ADC Cosinus |
|
Analogue voltage measured at the cosine signal input. |
ADC Sinus |
|
Analogue voltage measured at the sine signal input. |
Error
Different error statuses are displayed via the respective error bits (green = ok, red = error):
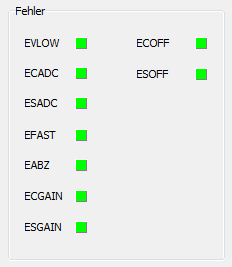
Error flags
Error-Flag |
|
Reason |
EVLOW |
|
The signal vector generated from the sinusoidal and cosinusoidal signals is smaller than 30% of the nominal amplitude. Usually, the cause is a partly or completely disconnected sensor. Another cause are input signals with a very large offset and a low amplitude at the same time. |
ECADC |
|
The A/D converter for the cosine signal is overdriven. The cause is that the signal amplitude is too high. This error may also occur with signals with very large offset at simultaneously high amplitude. |
ESACD |
|
The A/D converter for the sinusoidal signal is overdriven. The cause is that the signal amplitude is too high. This error may also occur with signals with very large offset at simultaneously high amplitude. |
EFAST |
|
The input frequency is so high that the direction can no longer be detected. |
EABZ |
|
Internal error flag, which is disabled for standard applications. |
ECGAIN |
|
The gain controller for the cosine signal has reached its limit. The cause is either that the signal amplitude is too low or the sensor is partly or fully disconnected. |
ESGAIN |
|
The gain controller for the sine signal has reached its limit. The cause is either that the signal amplitude is too low or the sensor is partly or fully disconnected. |
ECOFF |
|
The offset controller for the cosine signal has reached its limit. The cause is an excessive signal offset or a partly or fully disconnected sensor. |
ESOFF |
|
The offset controller for the sine signal has reached its limit. The cause is an excessive signal offset or a partly or fully disconnected sensor. |
Please note regarding errors:
Because of the limited data bandwidth, the live view only shows a part of the available raw values. Therefore it may happen that an error occurs but no corresponding value is visible in the live-view.
Reference index
The Bit ZSTAT becomes enabled once the reference index has been crossed.

