Irinos Measurement System
Requires the IrinosTool version 2.0.1.7 or newer.
If incremental encoders with 1Vpp interface are used, the signal quality has a major impact on the reliability of the measurement system. If the signal levels are out of specification, this can lead to measurement errors, which are detected by the Irinos-System.
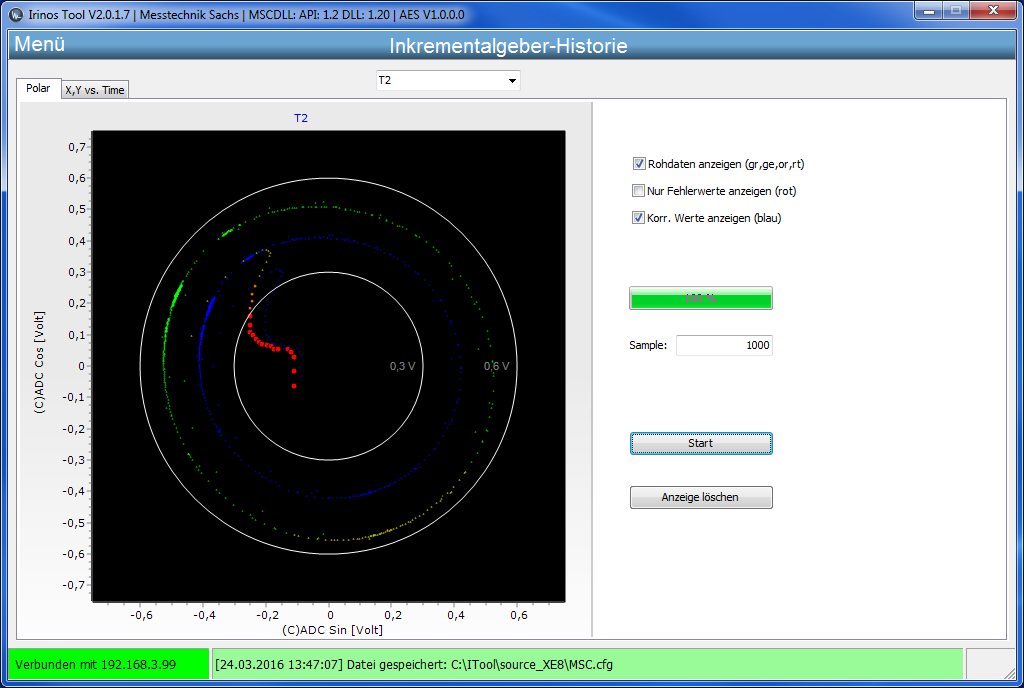
To get a better understanding, why an error occurred, the Irinos-System stores the last 1000 signal values (-> 1 second) before the error. These can be readout using the incremental encoder history of the Irinos-Tool. Like in the live view, they can be displayed in a Lissajous diagram. Alternatively they can be displayed over time.
The following screenshot shows an example of a Lissajous diagram (tab "Polar"). Similar to the live view, the measurement values are coloured according to the signal quality. Green ones are very good. If the signal quality becomes worse, they are coloured in yellow, orange or red (worst).
In the example, the final 16 values are displayed in red, showing a very poor signal quality.

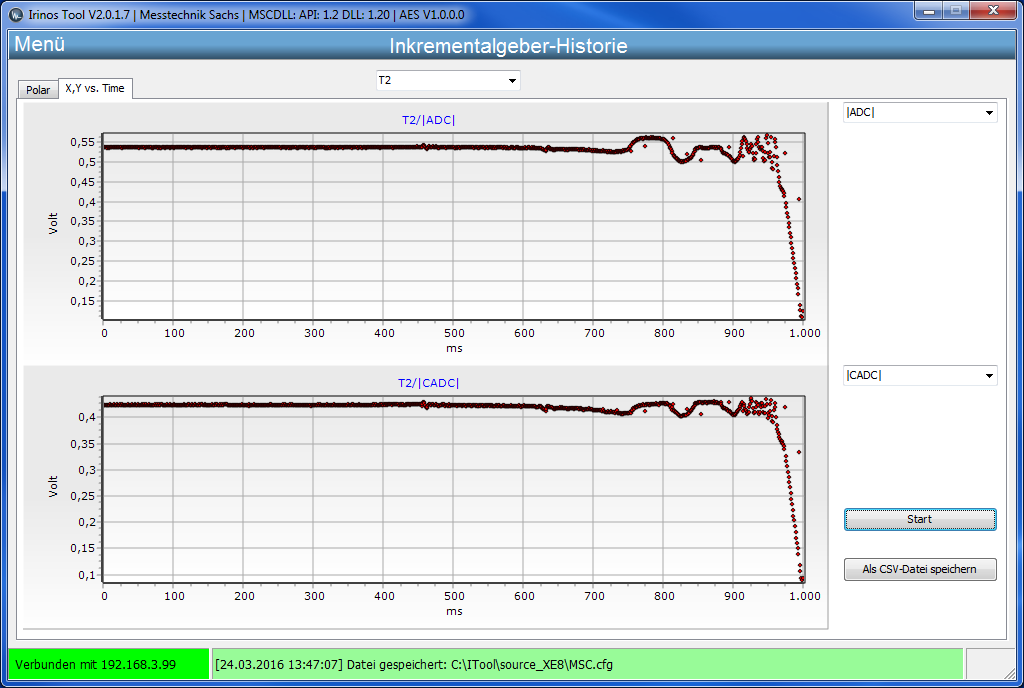
Another possibility is displaying the values over time:

Two vertically arranged diagrams allow for a time-based correlation of different values. Via selection menus besides the diagrams, the values to be displayed can be selected:
oAbsolute value of the ADC-Signals (corresponds to the signal vector)
oAbsolute value of the corrected ADC signals (as shown in the example above)
oSine value of the ADC signals
oCosine value of the ADC signals
oCorrected sine value
oCorrected cosine value
In addition to this, the error flags can be displayed. The different error flags are listed in the live-view chapter.
