
Irinos Measurement System
For diagnostic reasons, the Irinos system gathers all events reported by the local firmware in a non-volatile event memory. Events can be visualized via the built-in web server, or alternatively upon request within the Irinos Tool.
Diagnostic events are displayed for the entire system, i.e. event data is gathered box by box and finally displayed as a system-wide view. Grouping and sorting of events is supported to facilitate easy cross-box event analysis.
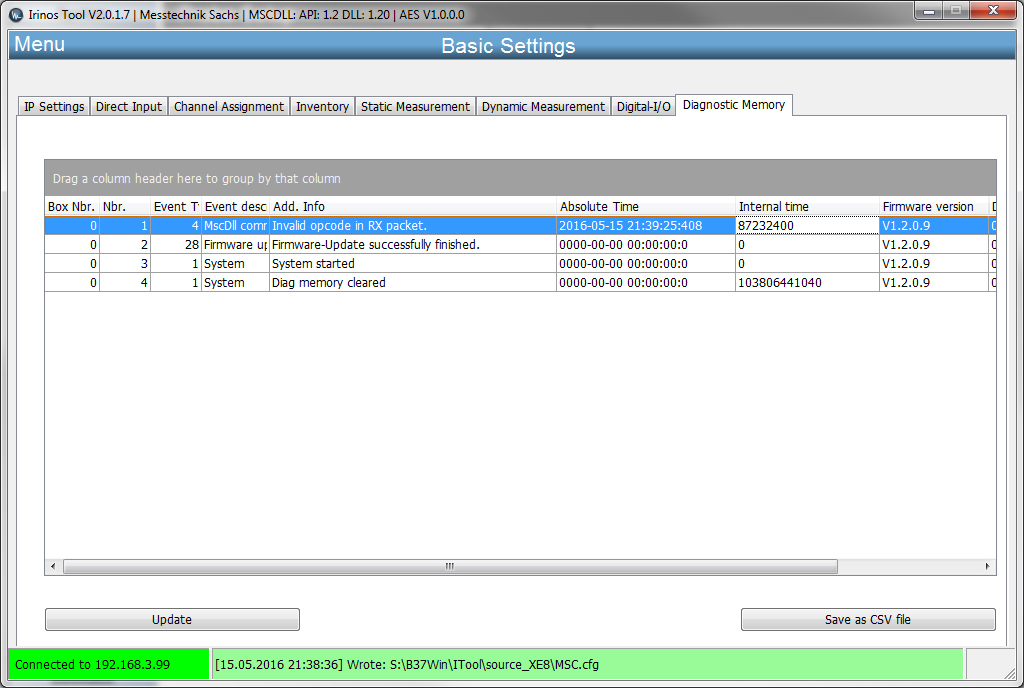
A diagnostic memory entry has the followings attributes:
Box-Nbr |
Number of the Irinos-Box: the event occurred at the Irinos-Box with this address. |
Nbr |
Event number (per Box) |
Event Type |
Event type (numerical value) |
Event description |
Event type as text |
Add. Info |
Additional information for the cause of the event |
Absolut Time |
Date/Time the event occurred (only available, if the absolute time has been set before). |
Internal Time |
Internal system time (ILink-Time, [µs]) |
Firmware version |
Firmware version at the time the event occurred. |
Debug Info |
Further information for manufacturer support. |
Newly-created events can be obtained by the update buttons.
If required, the entire event data can be saved into a CSV file by pressing the “Save CSV file” button. After pressing the button a file selection dialogue is displayed. File name and location can be specified by the user.
